How do I participate in this course

As an integral part of society, people are creating and disseminating data every day, information are transmitted between entities, resulting in a rich social network effect. With regarding to understanding and using social networks, this course explains the definitions of social networks, information, and human cognition, as well as semantic analysis and social network analysis as the main content. Through with writing blogs, project assignments, and group projects to facilitate the understanding of knowledge. The learning process and online participation are as follows.

Blog

I wrote three blogs separately to explain the social media analysis I understand, SDGs of the United Nations and the application of social media analysis in SDGs of the United Nations. The most relevant part is social media analysis.

Some knowledge is involved in social media analysis.

Social network

The first part is to understand what a social network is. The social network is composed of entities and links between them. In the social network, human is the entity, and human cognition is also learned in the subsequent courses. Human can convert the vision, sound and memory information into abstract information and convey body instructions.

Sentiment analysis

The second part, the method of social media analysis. This part involves sentiment analysis and social network analysis. Most of the data collected from social networking sites is text, which requires text analysis, such as NLP, language models, lexicon based approach for sentiment analysis.

Social networks analysis

When doing social networks analysis, we will analyze multiple indicators, Sciomatrix, Density, Degree Centrality, Closeness Centrality and Betweenness Centrality.  These indicators are introduced to find out the mutual relationships in social networks.

Project assignments

In project assignments, the participation in the blog was evaluated from two perspectives. The first is to calculate the frequency of positive and negative vocabulary for the content of others’ comments for scoring. The second is to use a matrix that records blog comments to perform social network analysis on social networks formed by blog interactions and calculate multiple indicators. The result of my participation is shown in figure 1.
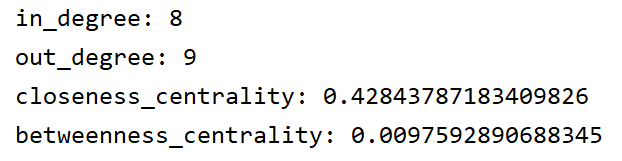
Fig. 1

The in_degree is 8, which means 8 people have leave comments on my blogs, corresponding to it is that I have reviews to 9 people. Closeness and betweenness represent shortest path between two vertices and betweenness of a vertex represents the proportion of shortest paths between all other pairs that the actor in concern resides on. In these part I got 0.4284 and 0.0098, from which I can find I am trying to participant but not so popular in the social network.
How to reduce hunger with social media analytics

In the first blog I talked about what is social media analytics, in this blog, I’m going to talk about applying social media analytics in helping reduce world hunger.

Social media

Social media is always a useful way to promote the world hunger, people know about companions in hunger in different regions, without access hunger, they can contribute to the reduction of hunger and rase money for hunger people. Using social media to help realize zero hunger, we always focus on its ability to disseminate information, for example, to start up an activity and funding for hunger on social media, with propaganda, to achieve the purpose of widely spread.

Social media analytics

Different from social media, the purpose of social media analytics is not to disseminate information, but to collect and analyze data. The information collected from social media can be divided into content that people post on related topic content and information that is not specifically targeted but can be used indirectly.

Directly analysis

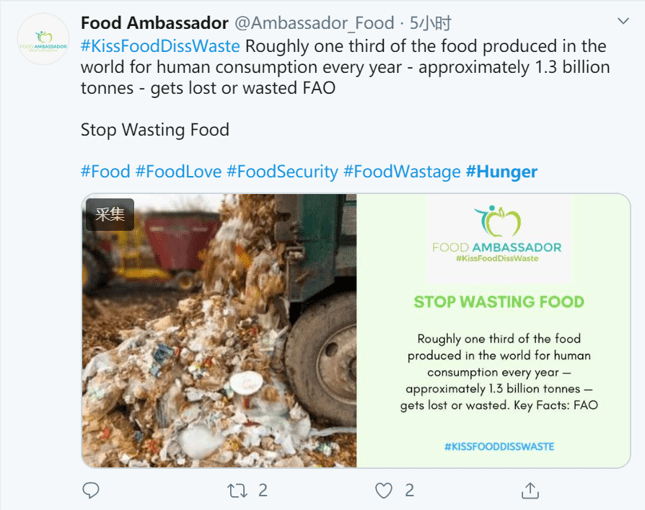
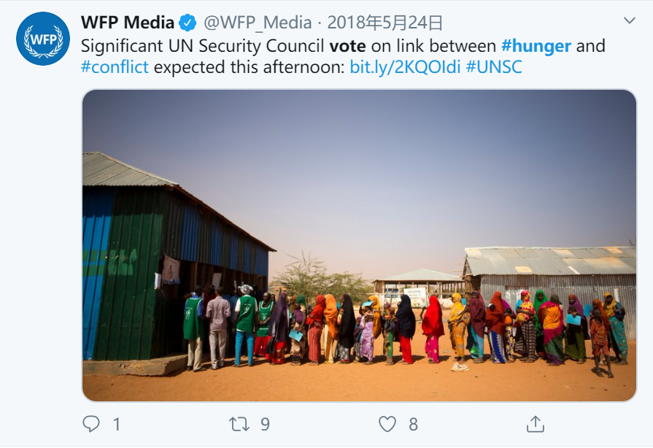
When activist publishes content on related topics on social media, and guides users to comment, like or vote, and the user’s views on the topic content can be digitization. In figure1, twitter can be sent with hashtag, those directly related data can be scraped and text analytics can be introduced for data analysis (e.g., people’s point of view and suggestions).

Figure 1: hashtag #hunger (source: Twitter)

In figure2, there is a link involves a vote website, the voting data can also be used for certain purpose.

Figure 2: vote (source: Twitter)

Indirectly analysis

Users do not directly follow the news or topics related to hunger, but the content shared by their social networking sites can obtain information related to the reduction of hunger. For example, many users post their daily lives on social media networks, including food-related parts. In different regions and different seasons, users’ sharing content will be different. Such information is collected, and through picture or text analysis, demographic-based food characteristics can be obtained. With the feature of foods in different seasons and regions, relevant departments can know about the trends of foods change and the preference of people, with the analysis of phenomena and behaviors, make some adjustments to food production.

No hunger

Some people cannot get sufficient food and result in malnutrition, when this condition continues for a period of time, we call it hunger [1]. From the definition we can conclude two key words “food deprivation” and “undernourishment”, that means hunger exist not only when people feel hungry but also when they can feed up themselves yet lack of vitamins or certain trace elements.

Statistics of hunger

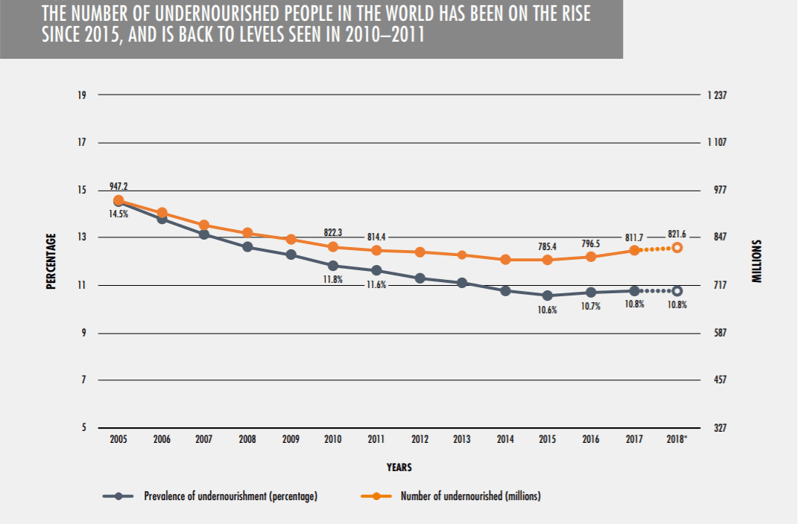
There was a rise in world hunger in a row, till 2019, there were 821 million chronically undernourished people in the world [2]. Figure1 shows the number of undernourished people from year 2005 to year 2018. After decades of declining, the figure of hunger people was on a rise since 2015 and continues for over three years. Evidence available in figure also supported that the prevalence of undernourished all over the world is approaching 11 percent, which means one in every nine people cannot intake sufficient nutrition to sustain daily consumption.

Figure 1: Number of undernourished in the world in 2005-2018 [3]

In figure2, the amount of undernourished people varies in different region. The most alarming area is Africa and the circumstance getting more serious recent years, the prevalence of undernourished people in Africa is the highest, slightly blew 20%, Asia is the second place at around 10% while Latin America, Oceania, Northern America and Europe are much less.

Figure 2: prevalence of undernourished in the world, 2005-2018 [4]

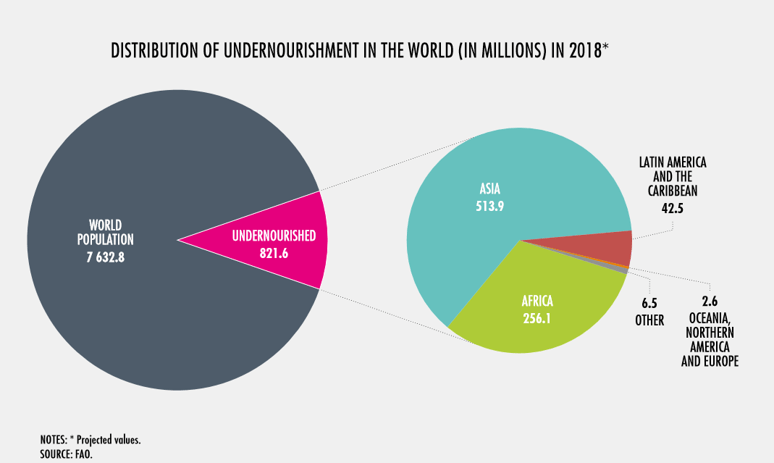
The undernourished number of Africa is less than that in Asia in spilt of high percentage. In figure3, from the distribution of undernourished in the world we can find the number of undernourished and its living area and it is majority in Asia, more than twice of that in Africa.

Figure 3: distribution of undernourished in the world in 2018 [5]

What causes hunger

The existing status of affairs are mostly driven by the combined effect of separate problems. Those problems can be sum up as extreme weather and economy marginalization.

Weather

Although it has improvement in crop yield potential, the climate still affects food production. The temporal change may have negative impact on soil conditions, water available, agriculture yield and susceptibility to pest. Those temporal conditions are global warming, weather extremes, ENSO phenomenon etc. Detrimental effects on yields can be done by ENSO or other large-scale forcing factors. Sometimes simple chaotic nature can also influence crops, which result in the downturn of food production. Not all factors can directly affect food crops, crops are sensitive to temperature, decreased precipitation and flooding while other factors can only have influence on soil process, nutrient dynamics and pest organisms [6].

Economy

Where economy has slowed down, there are more likely to have undernourished. People who are hunger are the poorest one in poor groups, that is where economy and politics cannot reach, they are bystanders of the contribution of wealth. Those people exist where they do not have chance to make money apart from work as day labors and they do not have credit rating, saving or assets. It is more likely to happen in region where economy downturn. Economy and hunger will have cross impact to each other afterwards [7].

Steps of no hunger

  • Put those furthest behind first
    • As I mentioned above, economy growth do not have an impact on those poorest people. So the first step and most importantly is to realize the full potential of globalize economy, make special protection policy to ensure those vulnerable have opportunities in economy growth, which is equitable to others. With the improvement of poorest people’s purchasing power, there will be new job opportunities, and change this dilemma.
  • Pave the road from farm to market
    • The entire period from production to sale is a supply chain. To improve the efficiency of food production, one possible method is to improve the corresponding supply chain, that is the production, delivery and selling. From three aspect we can achieve this, first is to explore the market, contrary to the market to produce crops. Then build up a transport routes, set warehouse on the line of transport. The last is infrastructure in rural area, to help with a fast and standard production, as well as connect to the transport line.
  • Reduce food waste
    • Those food we produced every year will be wasted at one third. It is ironically that the world can produce enough food to feed itself since 1960s. the payment of rich people to their famers in one week can meet poor countries’ aid needs for a whole year. So the debate is not only about shortage of food, but food surplus among rich countries and rich people, and the cost used for storage and disposal rotted food.
  • Encourage a sustainable variety of crops
    • Staple crops often require large yields and stability of production, in the world, there are totally four main corps are grown, rice, wheat, crop and soy. If encounter any disaster climate, four kinds of crops are not enough to resist risk. To confront the challenge of climate change, and promote food yield, diverge range of crops should be explored. The variable of kinds of crops can Improving anti-risk capabilities and increasing food production stability. Also, diversity of crops provides communities nutrients needed for health.
  • Make a nutrition a priority, starting with children’s 1000 days
    • Providing children with nutrients and foods is important, especially in their first 1000 days, nutrients is essential in this period, affect the development of their physical and brain. We must ensure to nursing the mother in their pregnancy and little kid can access to the required food and nutrients [8].

Reference

[1] https://en.wikipedia.org/wiki/Hunger

[2] 2019 – The State of Food Security and Nutrition in the World (SOFI): Safeguarding against economic slowdowns and downturn. https://www.wfp.org/publications/2019-state-food-security-and-nutrition-world-sofi-safeguarding-against-economic

[3]https://www.wfp.org/publications/2019-state-food-security-and-nutrition-world-sofi-safeguarding-against-economic, page6.

[4]https://www.wfp.org/publications/2019-state-food-security-and-nutrition-world-sofi-safeguarding-against-economic, page8.

[5]https://www.wfp.org/publications/2019-state-food-security-and-nutrition-world-sofi-safeguarding-against-economic, page14.

[6] Rosenzweig Cynthia, Iglesius Ana, Yang X. B., Epstein Paul R. and Chivian Eric, “Climate change and extreme weather events – Implications for food production, plant diseases, and pests” (2001). NASA Publications. 24.

[7] James T. Morris, The Economic Impact of Hunger, Indianapolis Economic Club (2004)

[8] https://insight.wfp.org/five-steps-to-zero-hunger-e7975823a87c

What is social media analytics


Figure 1
Figure 1

Social networks consist of entities and links between them. Entities are human and organizations, links between them are social connections such as friendship and family ties[1], in Figure 1, one human is the entity and the link connect he and other entities. Social media is a representative way to implement interaction of users[2], the relationship of each online identities on social media forming a network of social ties. This kind of connection contains a lot of information because of rich services provided by social media, which result in a large amount of data can be used for certain purpose. This is the origin of social media analytics in my understanding.

Definition

The more complete definition of social media analytics is to utilize the data collected in social media platform, with specific objective, analysis from the perspective of content and networking, finally contributes to informed and insightful decision making or prediction[3]. It can be found from the definition that the process of social media analytics is roughly divided into five parts, which includes motivation and purpose, data collection, analysis, interpretation, prediction and decision-making[4]. Figure 2 shows the general process of social media analytics.

Figure 2. process of social media analytics

The purpose of social media analytics may vary from case to case but can be summarized and classification into two categories, one is to study social behavior of online identities (e.g., interaction of social media users, newly emerging topics, etc.), the other is to make improvement on online service in order to better support social activities (e.g., improvement version of recommendation system )[5].

To facilitate the analysis of social media, collecting user-based data on social media platforms, which are users’ personal information, demographic information and data generated by users’ online behavior [6]. With this range of data, mathematics and computational methods are applied to representation information from both humanities and technologies aspects[7].

Data source

Source data are collected from social media such as Twitter, Facebook and Instagram. The first step is to scrape data, those data is accessible when applying APIs. The raw data is unstructured and contains many noises, the next step is to clean the raw data, normalize the text and remove unstructured entries. After then the data can be used for analysis[8].

Analysis methods

Three methods are introduced for analyzing.

Text analysis

Text analysis is a technique used for content analysis. In social media spectacle, many commit and review are made to express users’ point of view. because of the massive text information in social media, quantitative methods are required to classify the data. Text classification, such as one important analysis technique in social media analysis, sentiment analysis, is a considerable method which can be classified as supervised and unsupervised leaning. With this method data can be detected positive/negative (supervised) or cluster into groups(unsupervised).

Social network analysis

Network analysis study the relationship between online identities. From the relationship in between online identities, some communities who always share similar opinions can be found as well as influence factor of each identity. With the analysis result there are possibilities to influence opinions in social networks.

Trend analysis

Hot topics and newly emerging trends are keeping change on social media, trends analysis can be helpful to predict the coming one. To achieve this, a model or framework should be built to represent the trend and life cycle of one topic. One method is suggested to identify items that attract lots of attention in early stage. Social media activities are modeled with a stochastic model that intuitively captures the concept of attention gathering information items [9].

References

[1] Lecture notes page 15.

[2] Lecture notes page 20

[3] https://en.wikipedia.org/wiki/Social_media_analytics

[4] Lecture notes page 28

[5] Lecture notes page 25

[6] M. Mathioudakis, in Encyclopedia of Database Systems, edited by L. Liu and M. T. Özsu (Springer New York, New York, NY, 2018), pp. 3528-3532.

[7] Lecture notes page 26

[8] Batrinca, B. & Treleaven, P.C. AI & Soc (2015) 30: 89.

[9] Stieglitz, S., Dang-Xuan, L., Bruns, A. et al. Bus Inf Syst Eng (2014) 6: 89.

Design a site like this with WordPress.com
Get started